Work / 2025
IsobarClimate data that a planning office can act on.
- Client
- Isobar Climate
- Year
- 2025
- Role
- Product design, Data visualisation, Front-end engineering
- Team
- Selma Varga, Mats Eide, Jonas Haugland
The brief
Isobar Climate is a non-profit of nine people in Bergen. It turns ten regional climate models into 1 km grids for Norwegian municipalities: temperature, heavy rain and snow, back to 1961 and forward to 2100. Until 2024 it sent them out as data files and a 60-page PDF per municipality.
The people who need the numbers are planners deciding where to build and engineers sizing drains. Few had ever opened the files. Every autumn, before the budget round, they emailed Isobar the same three questions: how much has it changed here, how much will it change, and what should we plan for.
The brief was one product that answers those questions for your own municipality, and hands you something a council can read in the five minutes it gives each item. It had to work on a projector in a bright room and on paper.
What we decided
- 1
Keep 1961–1990 as the normal
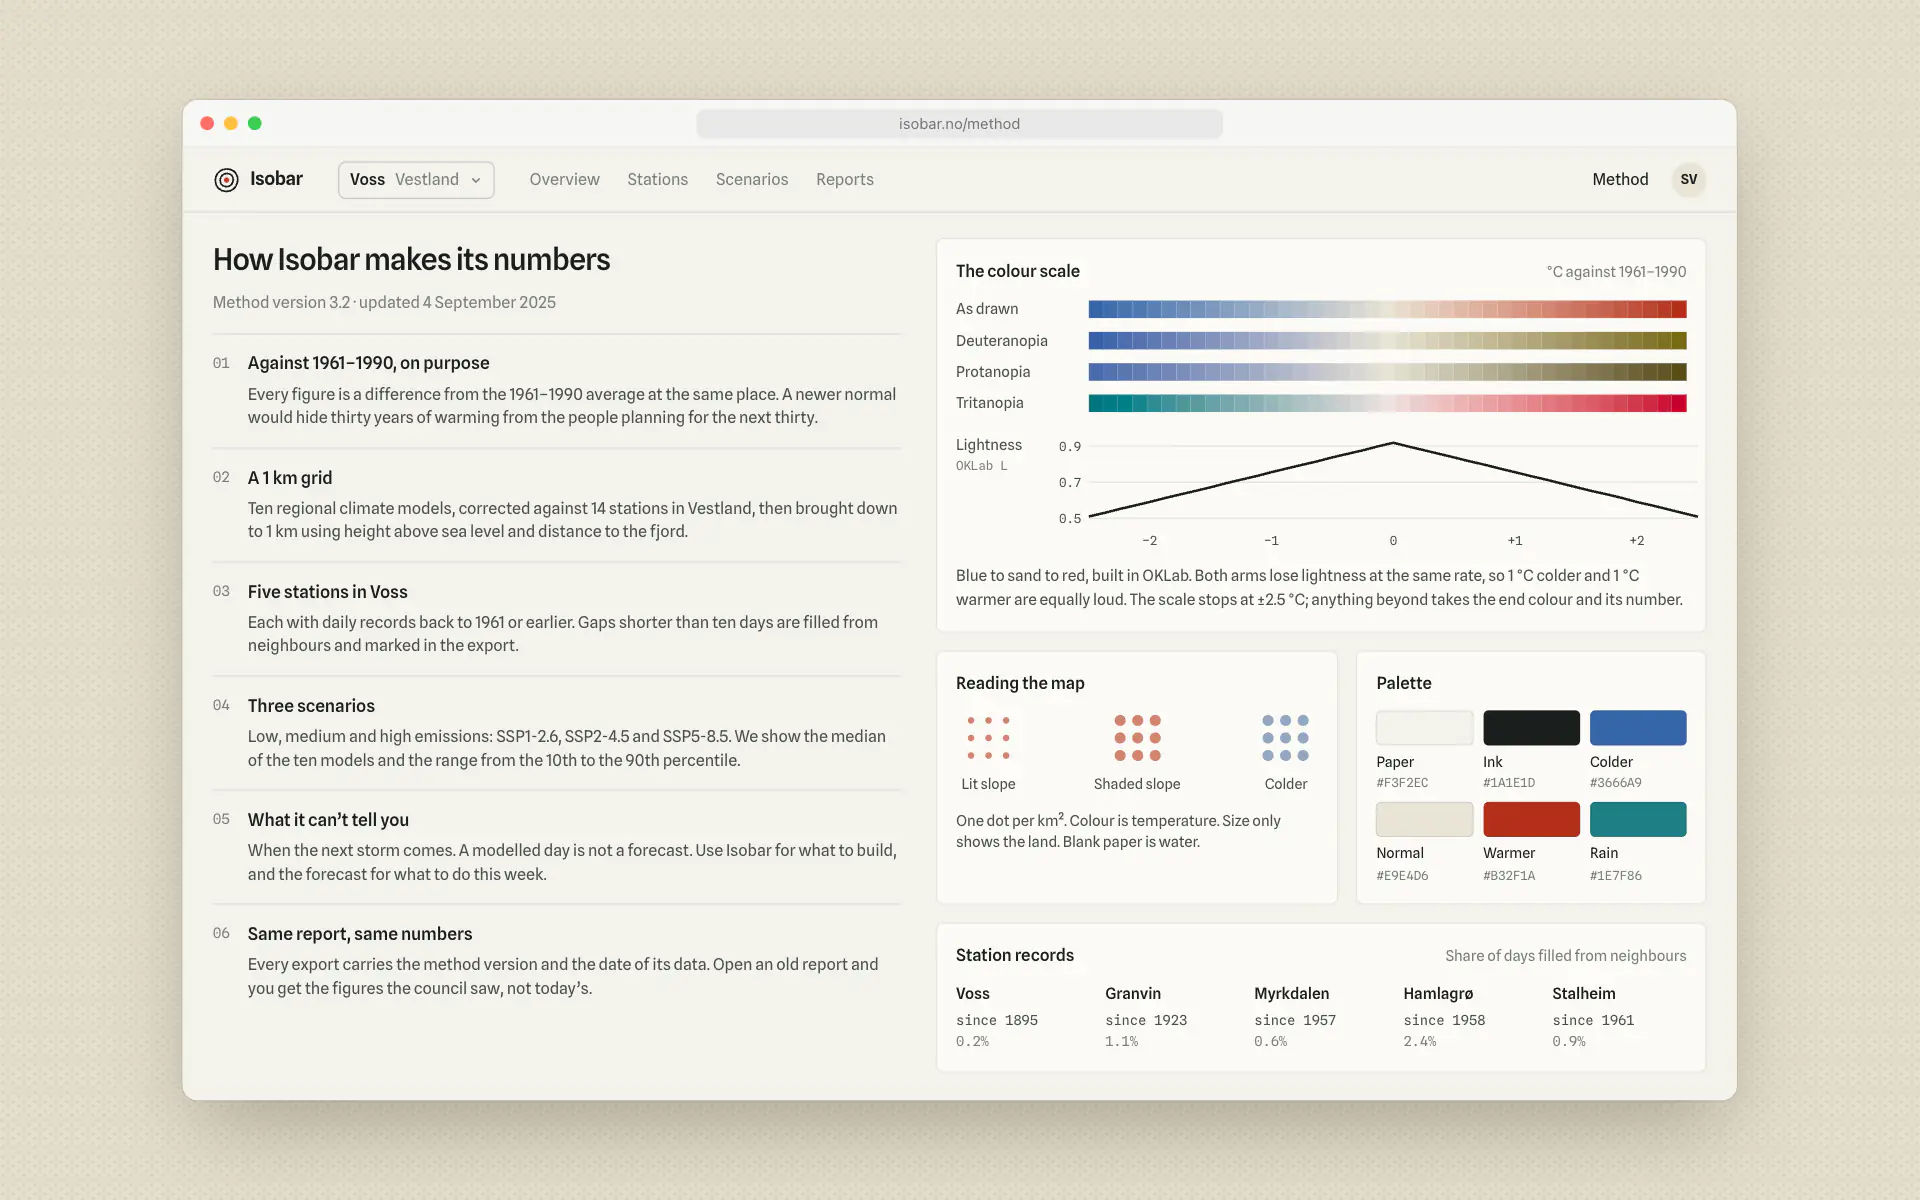
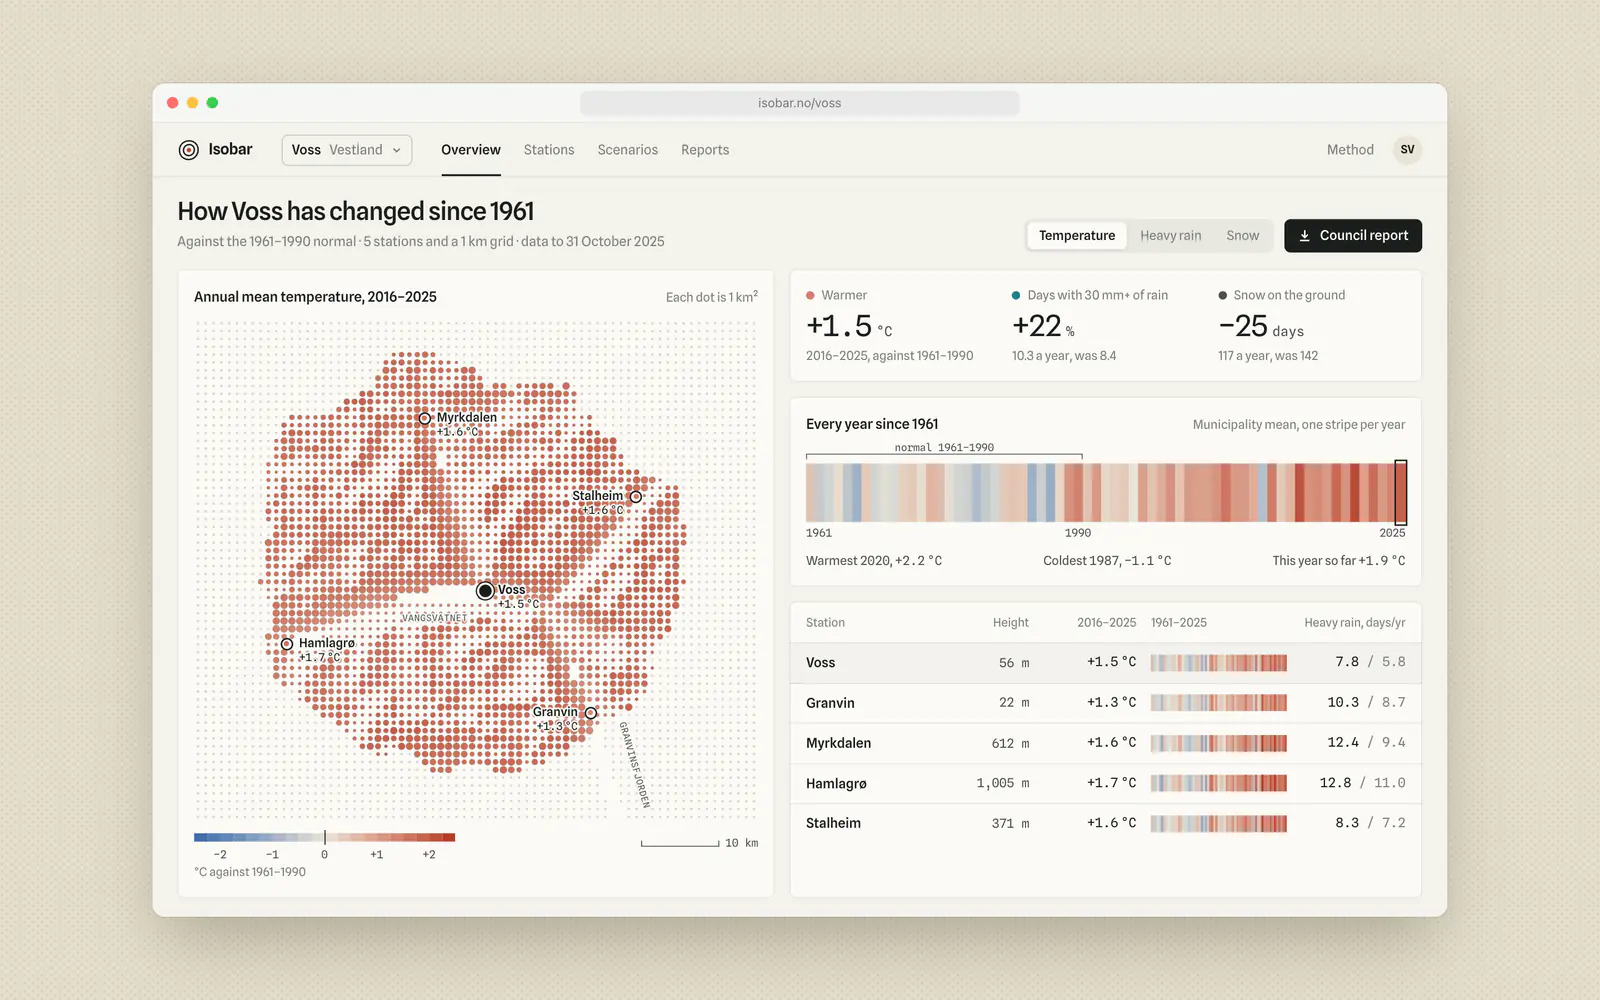
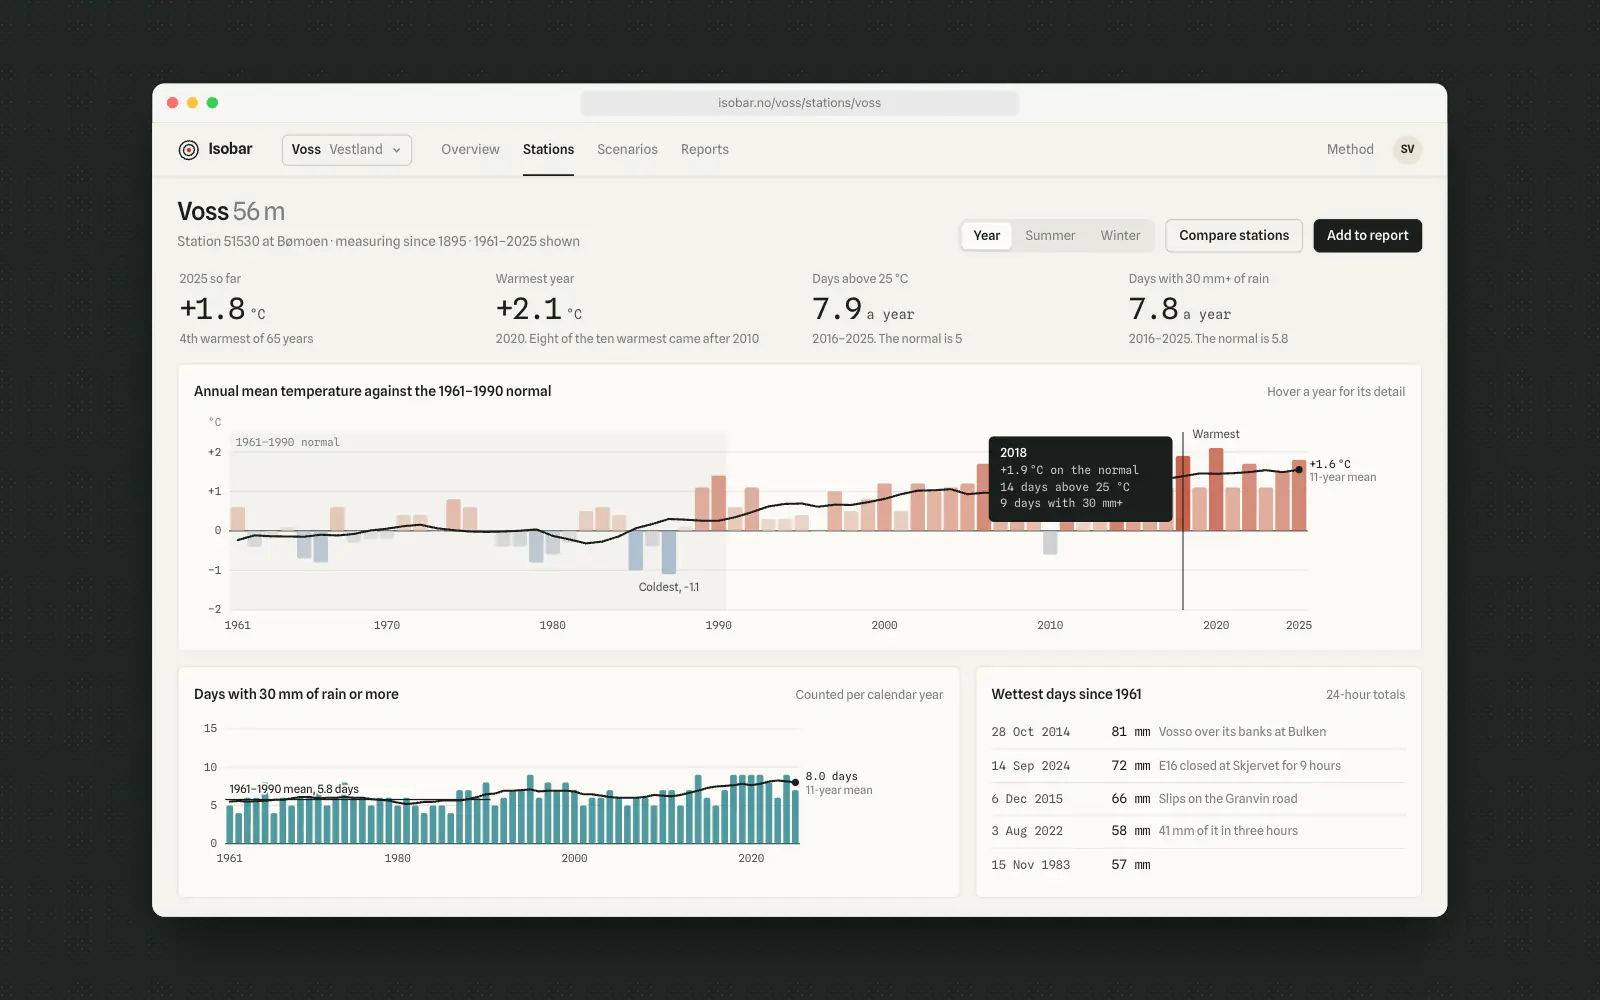
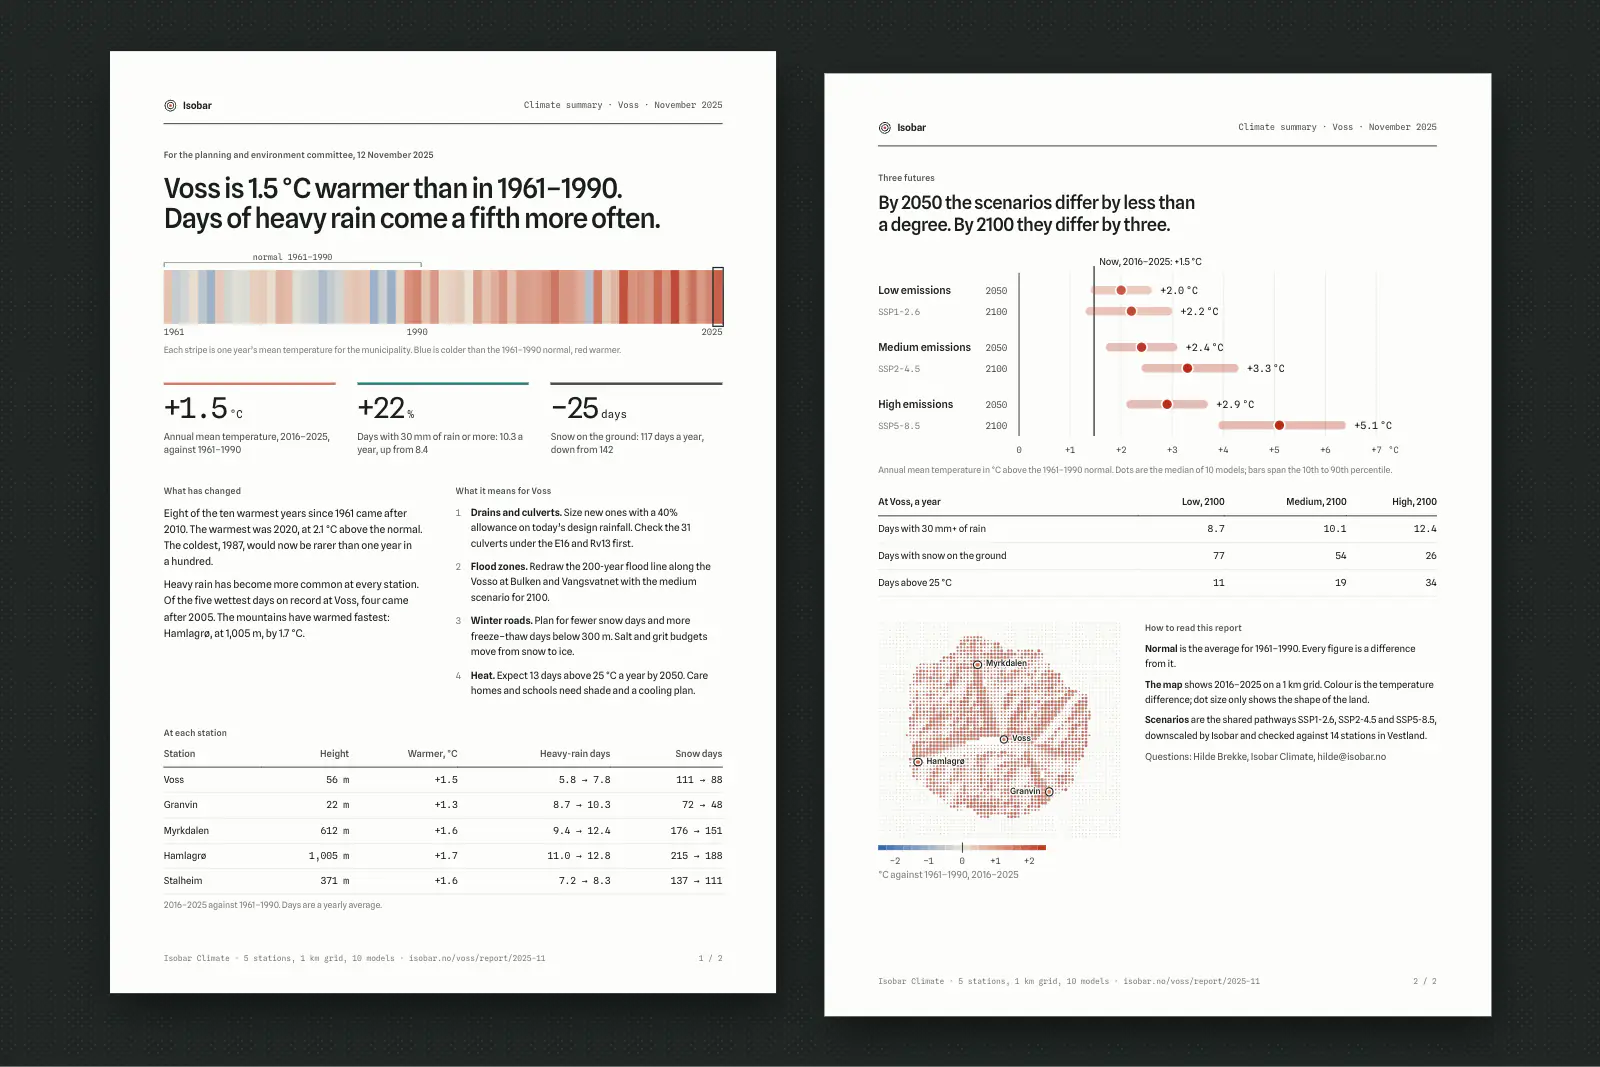
Climate services have moved to 1991–2020 as the standard normal. We tested both with eight planners. Against the newer normal, 2025 looked half a degree warm, and two of the eight read that as “not much has changed”. Against 1961–1990 it is 1.5 °C. We kept the older normal everywhere, and every chart says which one it uses.
- 2
One colour scale, balanced by measurement
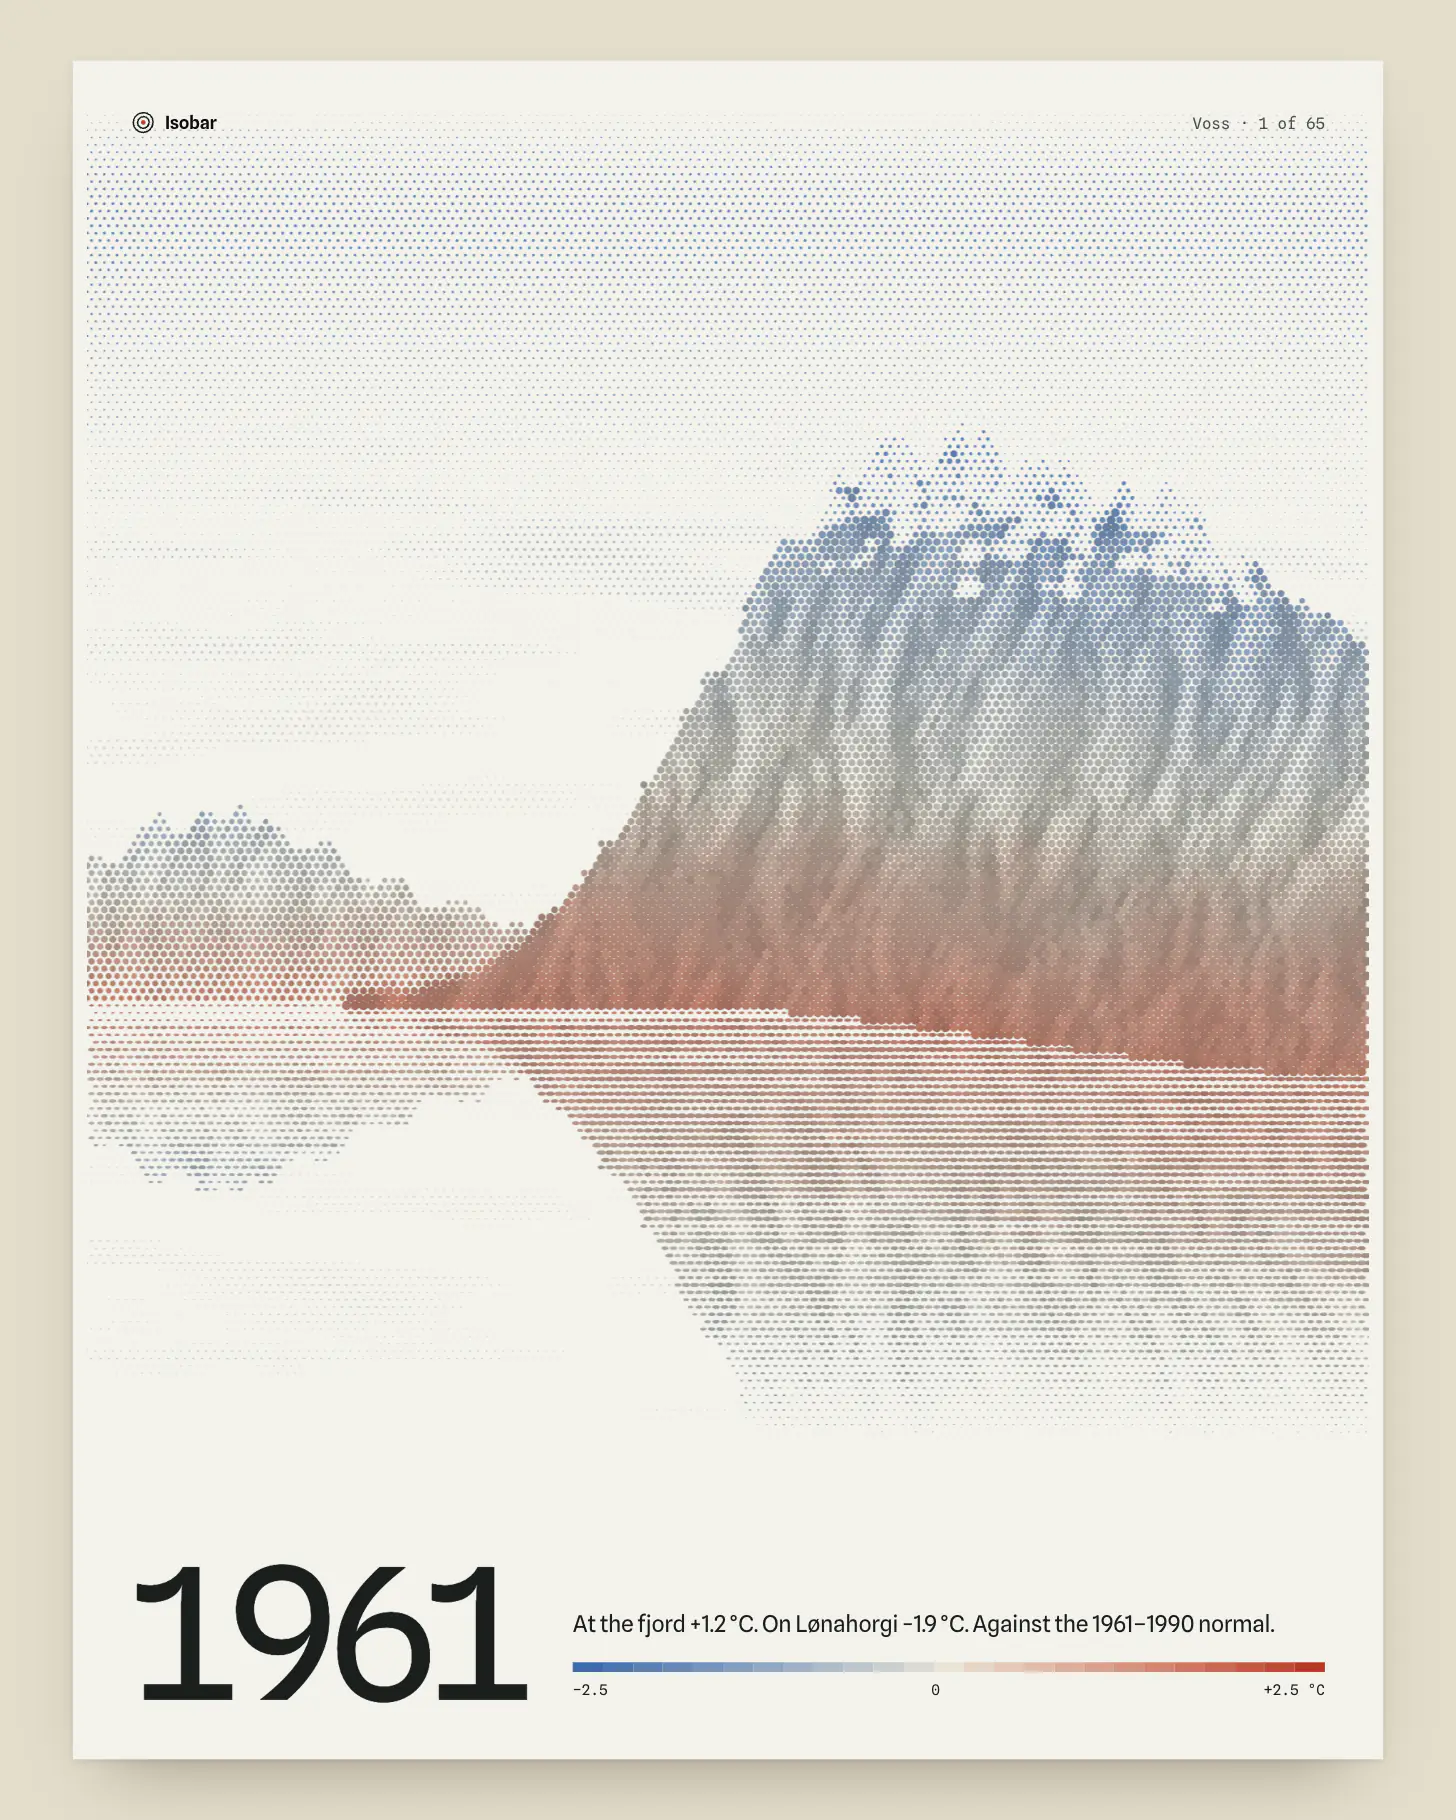
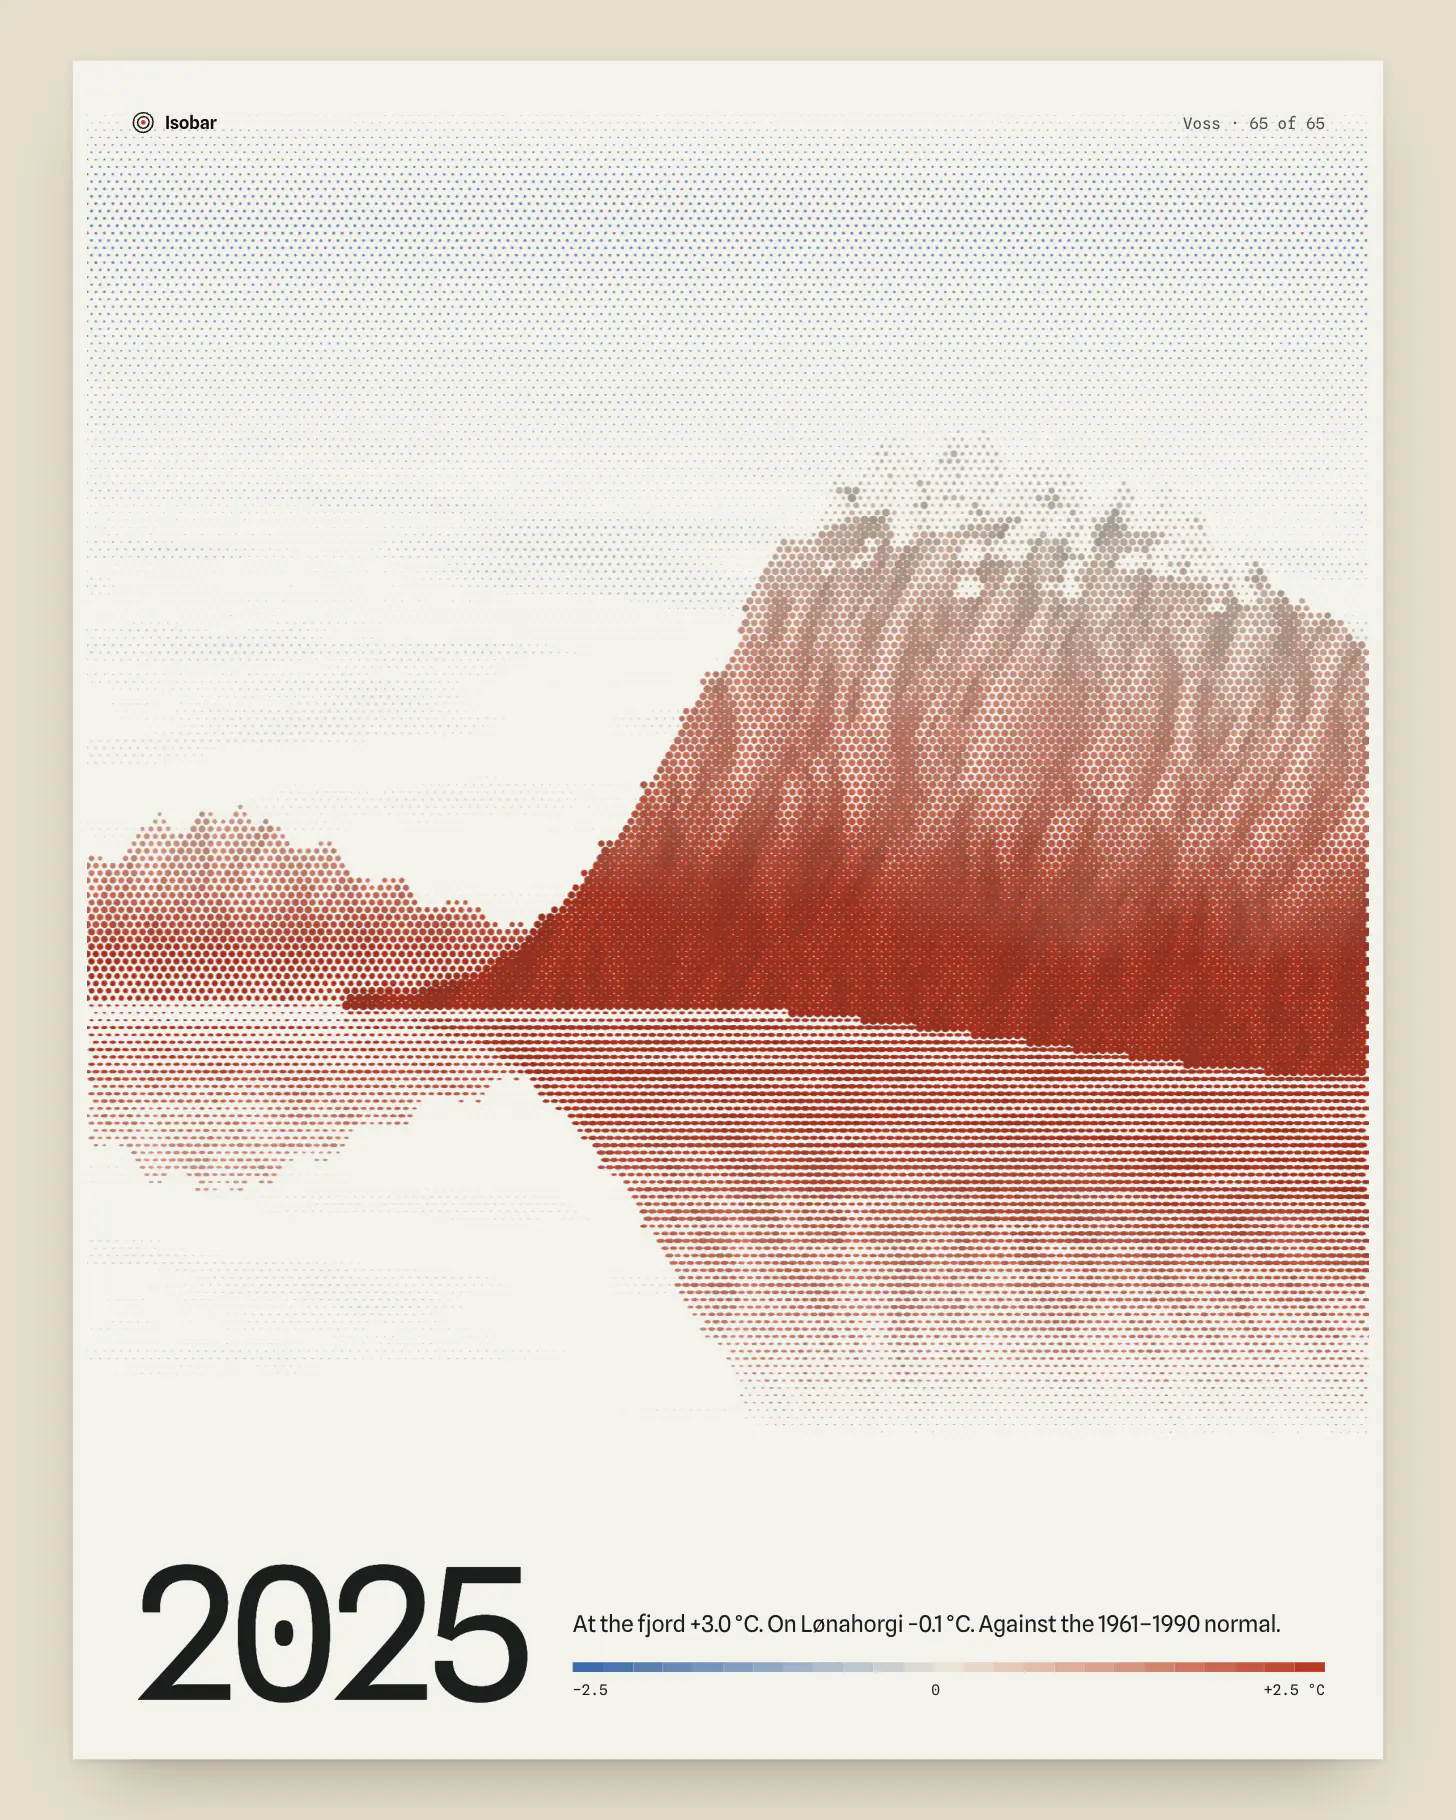
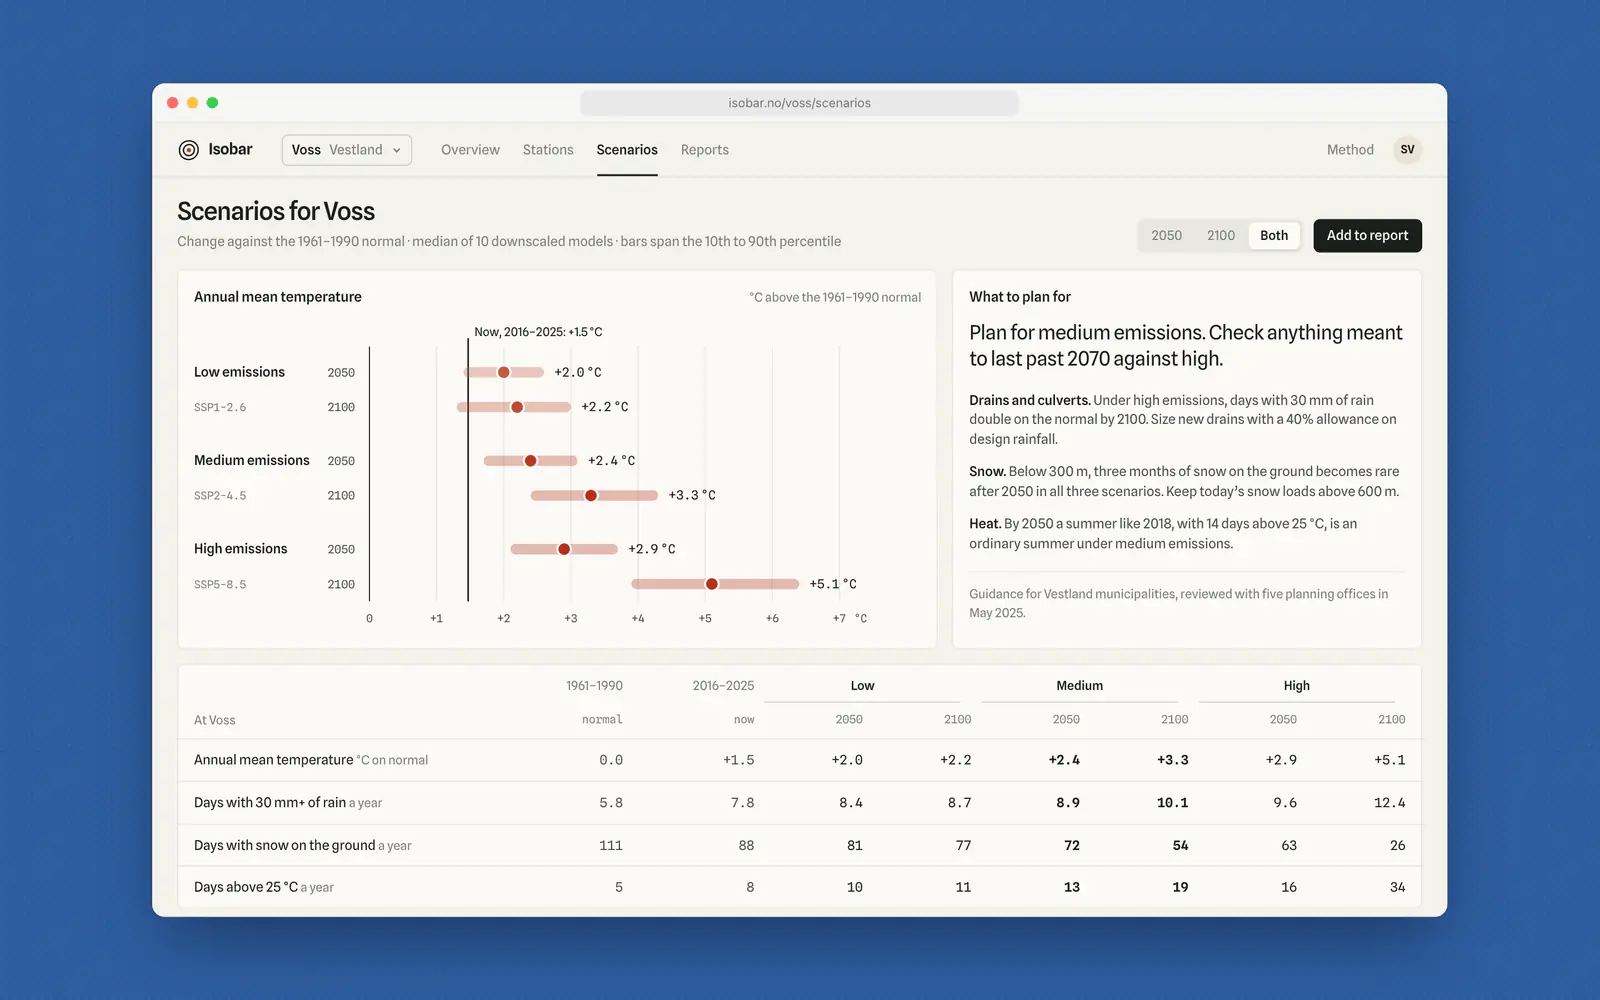
Every temperature in the product, on the map, the stripes and the scenario dots, uses one scale: blue through sand to red, centred on the normal. Our first version used the brand red and blue as they were, and warm years looked about a third louder than cold ones. We rebuilt it in OKLab so both arms lose lightness at the same rate, and checked it for the three common forms of colour blindness. The number is always printed beside the colour.
- 3
Dots, not a smooth heat map
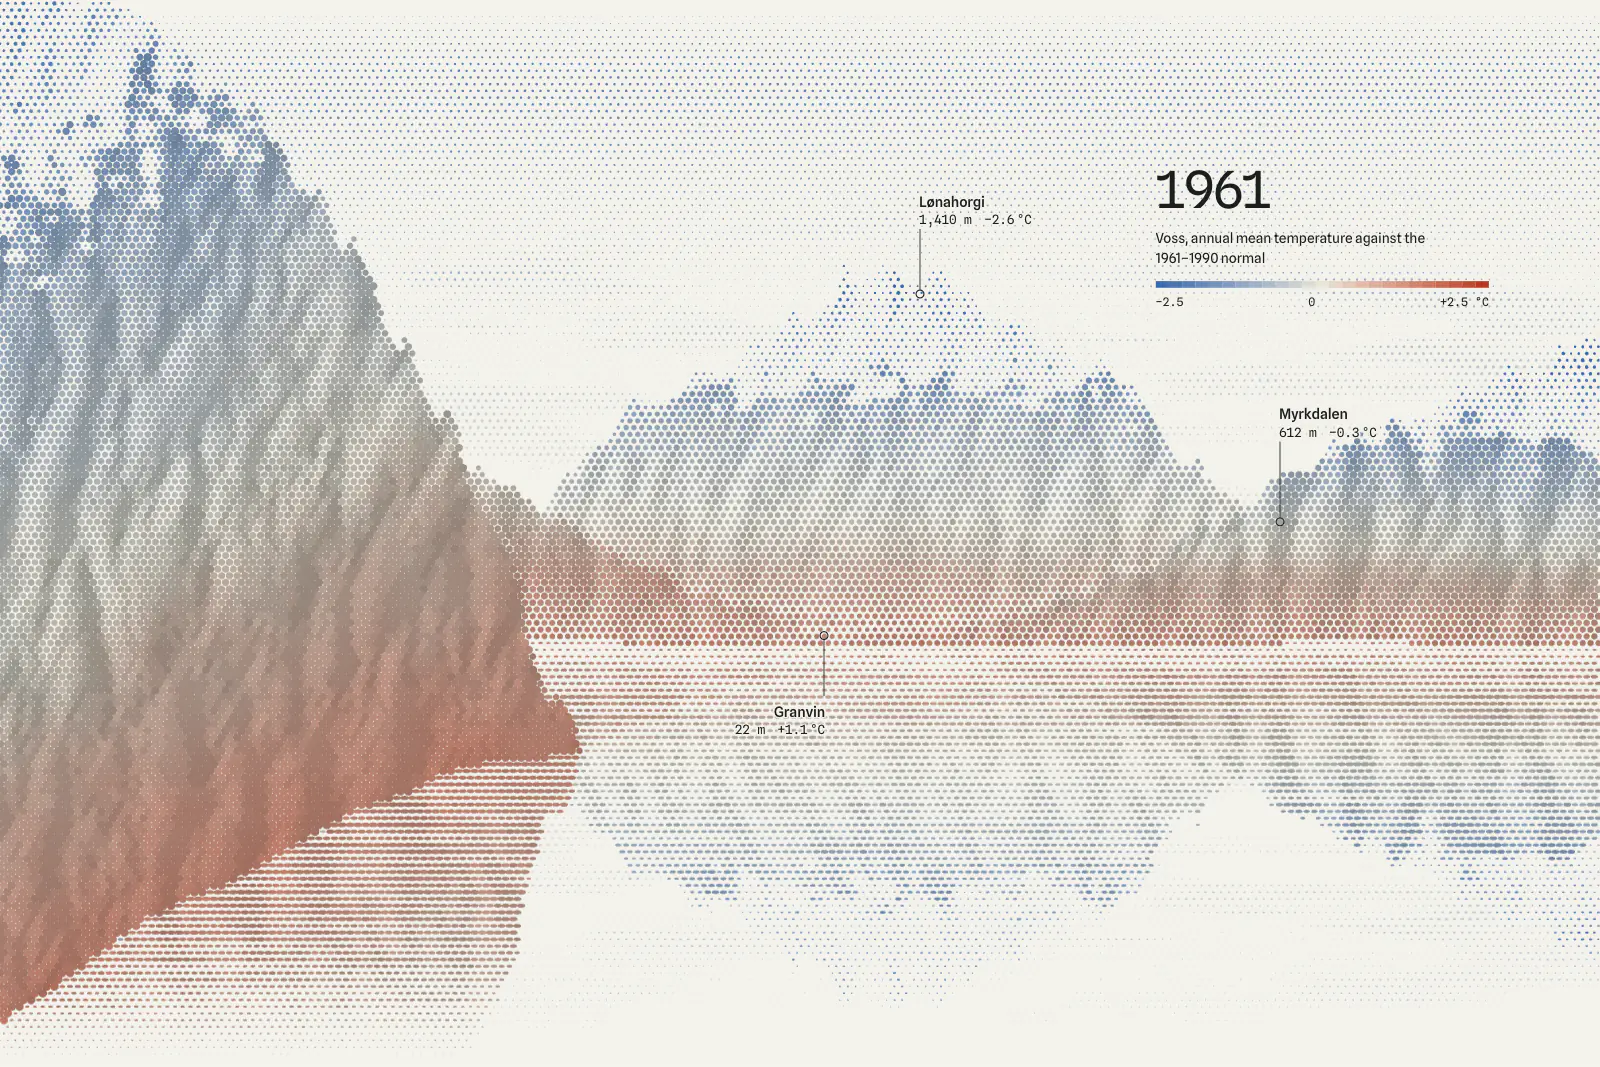
The map is a halftone: one dot per square kilometre, coloured by temperature and sized by the shade of the terrain. A smooth raster, our first attempt, read as a weather forecast, and planners trusted it down to their own street. Dots say “1 km” without a legend, and the valleys and fjords stay recognisable, so people find home before they read a number.
- 4
Every number comes with a sentence
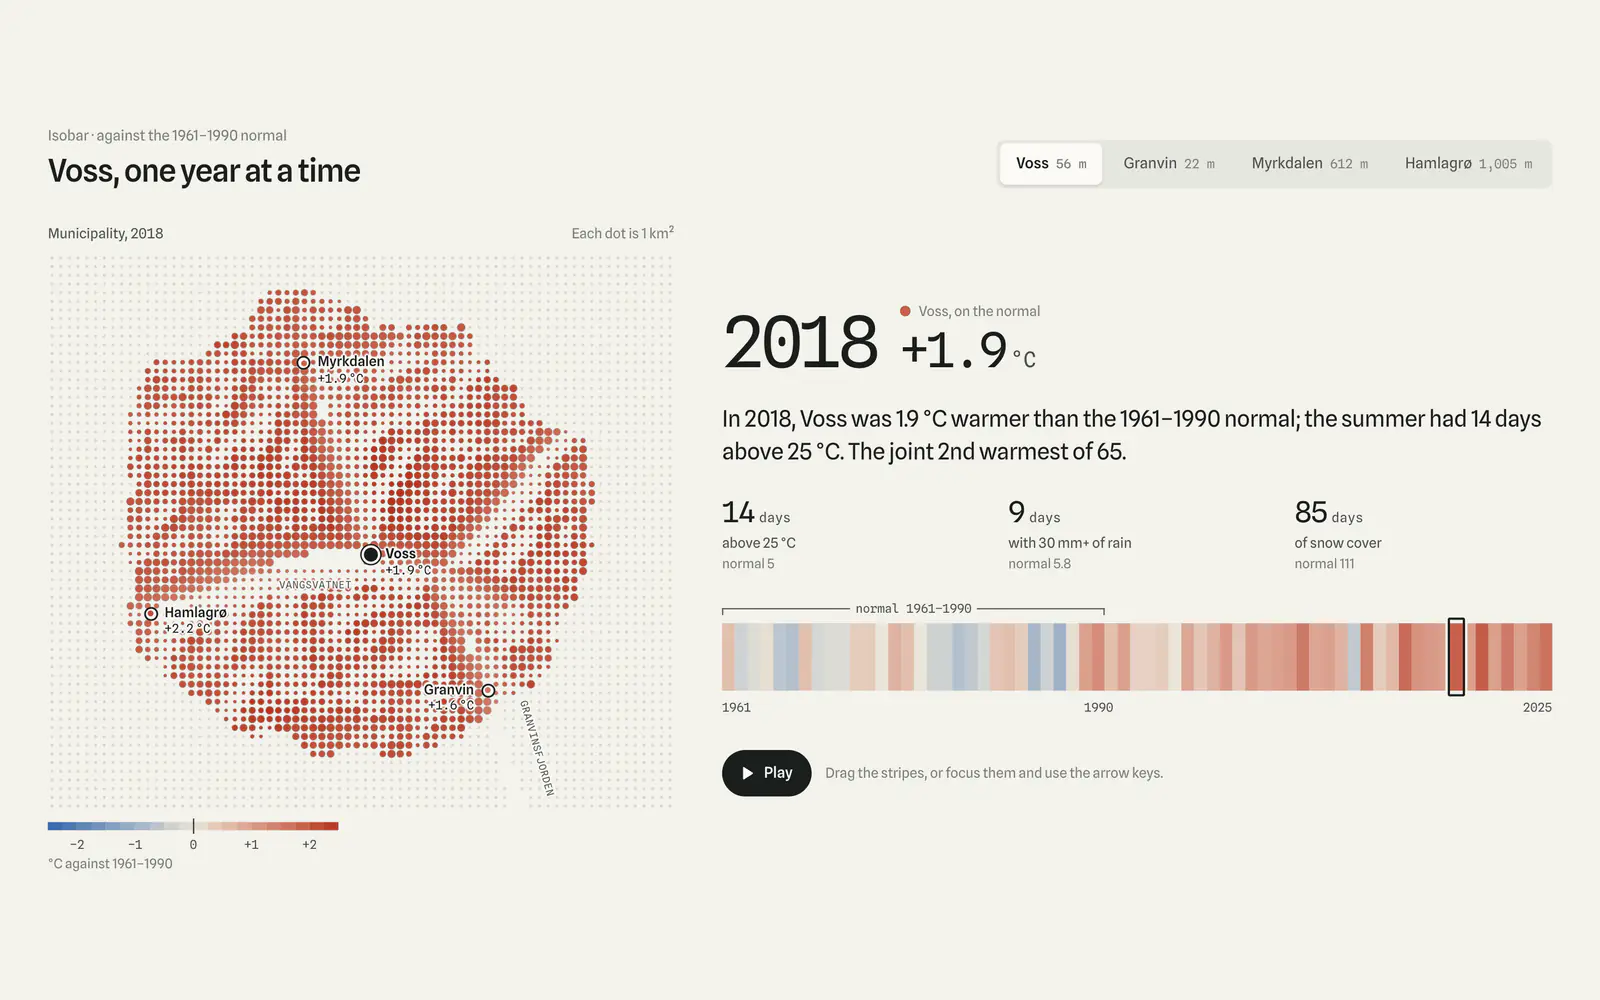
Each year, station and scenario has a sentence written from the same data: “In 2018, Voss was 1.9 °C warmer than the 1961–1990 normal; the summer had 14 days above 25 °C.” Planners were pasting these into their case papers, so we built the council report from them: two typeset A4 pages, with the method version and data date in the footer.
- 5
Alerts for the person with the spade
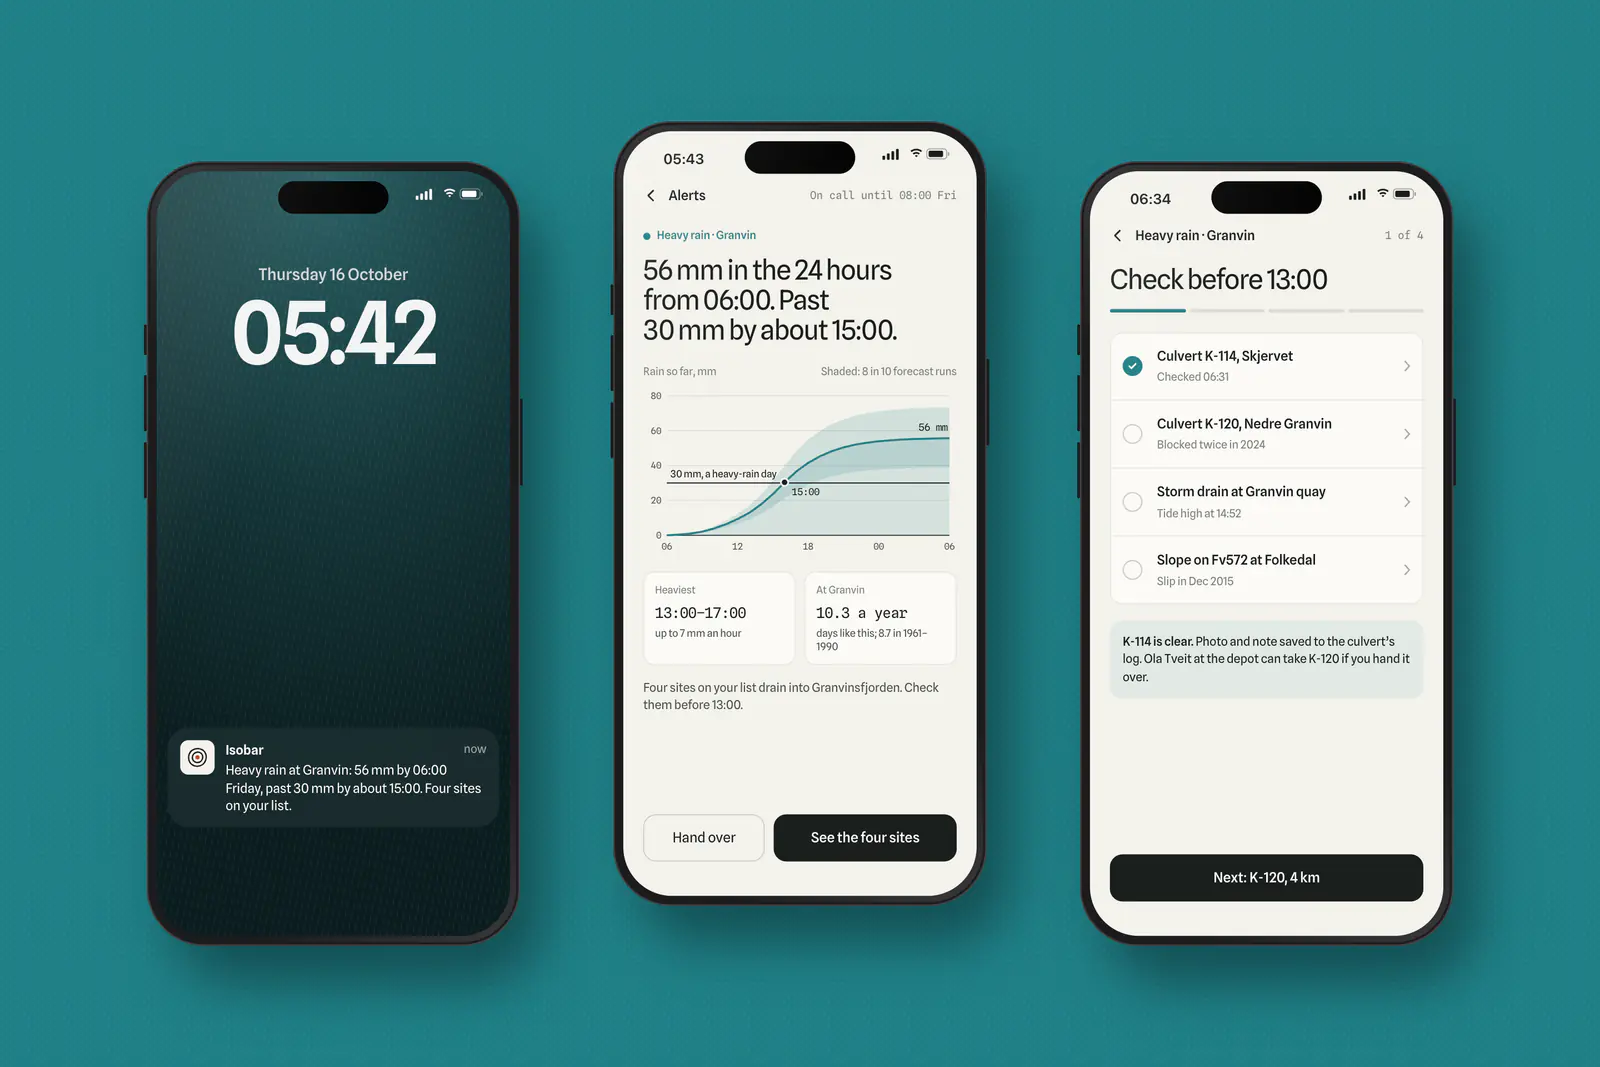
Engineers on call act on heavy-rain days, not on 2100. Their alert turns the forecast into a 24-hour total against the 30 mm line that defines a heavy-rain day, then lists the culverts and drains to check, in order. The climate record sits underneath it: Granvin now has 10.3 days like this a year, up from 8.7.
What happened
Isobar launched in March 2025 with six municipalities in Vestland and now serves 23. Planning offices write their own council summaries, and data questions by email before the budget round fell from about 140 in 2024 to 31.
We built the product in React with Isobar’s two developers and handed over the chart components, the colour scale with its tests, and the report templates in August. They have since added a drought view on the same parts.
Three questions
We read two years of email from planning offices to Isobar. Nearly all of it asked one of three things: how much has it changed here, how much will it change, and what should we write in the plan.
So the product has three pages, one per question. Each ends in something a planner can lift straight into a case paper: a sentence, a number with its unit, or a chart that names its own baseline.
“I used to send the council a table and a link. Now I send two pages, and the questions are about what to do, not what the numbers mean.”
- municipalities using Isobar, up from 6 at launch
- 23
- fewer data questions by email before the budget round
- 78%
- median time from opening Isobar to an exported council report
- 11 min
- council case papers that quoted an Isobar sentence in 2025
- 41
Isobar Climate’s figures, March to October 2025.